Remote GIS mapping in Dholpur: Co-production with co-researchers
Abdul Awal and Imran Hossain Mithu explain how Geographic Information System (GIS) was used by the ARISE team in Bangladesh to map Dholpur in Dhaka.
GIS mapping is a commonly used technique for visualizing an area. It can be used in a variety of ways to visualize health service utilization as well as consider the many factors related to location, which may limit people’s ability to access care from acquiring proper heath care.
Location-allocation models can identify how gaps in health services among specific communities can be reduced. Existing health services are mapped along with road networks which are used to identify and facilitate patient travel pathways and related challenges. Valuable information such as population distribution, income and poverty levels, can also be depicted to determine the best possible placement of new services, as well as to identify specific regions that are underserved.
ARISE is using a community-based participatory research approach to understand community dynamics and health and wellbeing related vulnerabilities, practices, challenges, needs and priorities. Participatory GIS mapping is one of the methods the ARISE Bangladesh team has chosen to map and document the layout of slums, infrastructures (health facilities, religious places, educational institutions, bazars, government offices, water, and electricity supply offices etc.), roads, health facilities etc.
A transect walk is a systematic walk along a defined path (transect) across the community/project area together with the local people to explore the water and sanitation conditions by observing, asking, listening, looking, and producing a transect diagram. Initially, we had a plan to co-create GIS map in April 2020 with the help of co-researchers during transect walks and then synchronize information collected through social mapping into GIS map to complete the mapping.
Suddenly the dark shadow of coronavirus loomed over us and Bangladesh was not shielded from this heinous pandemic. It seized the country from the beginning of March 2020 and is continuing. The country went into lockdown resulting in a suspension of all research field activities to ensure the safety of researchers and co-researchers.
As a result, the ARISE hub decided to apply innovative remote methodologies to research, especially data collection. The ARISE Bangladesh team came up with an innovative idea of testing remote GIS mapping and involving co-researchers remotely in the process. We were a little bit baffled at the beginning about how to complete the remote mapping, but we were able to devise a way forward.
The search for accurate data
We used QGIS 3.10.6 software for drawing the maps. However, the first challenge we faced at the initial stage was to locate our study slums from the QGIS Open Street map. We could only clearly locate Kollayanpur slum among three study slums. One possible reason could be that Kollayanpur is an old and well-known stable slum established in public land. The other two slums – Dholpur and Shaympur are comparatively new settlements and the boundaries of these slums were not identifiable using Google or Open Street maps. Therefore, we decided to search other secondary sources. However, the challenge we faced at this stage was accessing required secondary data about the three selected study sites due to unavailability of the proper data, which is essential for producing GIS maps.
In Bangladesh, slum specific data is limited and unavailable for most of the slums. The available online sources are also not updated. We found some data form the Census of Slum Areas and Floating Population 2014, however, we couldn’t use that 15 years old data as most of the slums in Bangladesh are not stable and the landscape has changed over the period. We also found some other data sources, like some survey reports or published papers from other research. However, again that data were either too old or did not have our study site specific data.
Then we explored Dhaka city maps from both North and South Dhaka City Corporations. We could only manage a digital map from Dhaka North City Corporation, unfortunately that was also not updated. We could not get a digital map from Dhaka South City Corporation as the process of getting map requires physical visit to the City Corporation office which we could not do due to the lockdown. It was also difficult to identify the specific slums from the available sources. Therefore, we applied different strategies for different slums.
In this blog, we will share our experience of conducting remote GIS mapping of Dholpur slum where we were able to involve a co-researcher remotely in the mapping process.
Mapping Dholpur
Dholpur, a slum located in the southern part of Dhaka city under Dhaka South City Corporation, is home to approximately 135,000 people and most of them are City Corporation workers, rickshaw pullers, waste collectors and daily wage earners. People from ethnic minority groups live there, such as the Telegu community. Schools, colleges, mosques, temples, churches and healthcare facilities are some important infrastructures around the slum. Also, there are some informal health facilities for example drug shops.
To create the GIS map of Dholpur slum, we synchronized data from multiple sources, multiple digital maps and mapping software. A co-researcher from Dholpur slum guided us throughout the whole process from the beginning to the end by providing information and validating our maps at different stages.
Step 1 – Drawing the outline
We were unable to identify the area outline of Dholpur slum from the QGIS Open Street map, Google Earth Pro, online sources, and digital maps from Dhaka South City Corporation. Earlier in the research we had met some enthusiastic members of a local youth organization in Dhlopur slum who have been actively involved in many community-based activities. We decided to reach out to them again and request their support in the remote GIS mapping as they know their community better than us.

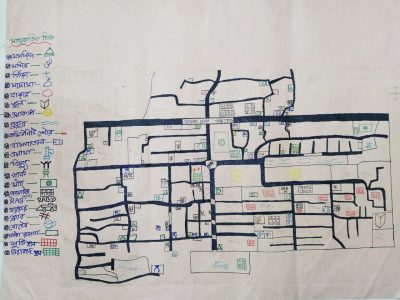
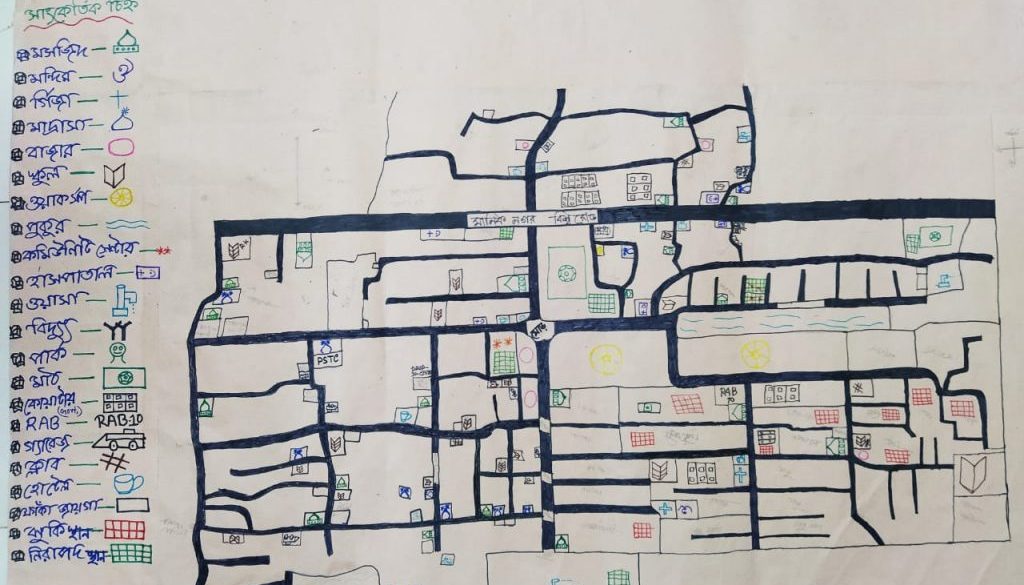
Anwar Rana expressed an interest in working with us as a co-researcher and helped us with mapping. After explaining to him our purpose over the phone, he shared a hand-drawn community map (Figure 1) through WhatsApp. The members of the local youth organization drew the community map for the purpose of managing their organization’s activities. We were surprised and amazed by the level of detailed information in their map. That map gave us an initial idea regarding Dholpur slum area.
Then we identified Dholpur slum area in the QGIS Open Street map and drew an outline with the help of the hand-drawn community map and shared the screenshot of the map with the co-researcher through Facebook Messenger for validation. After seeing the outline, we made, Anwar marked the Dholpur slum boundary in the Google map and shared his screen with us which helped us to finalize the boundary.
Step 2 – Drawing roads and pathways
After finalizing the area outline, we started the next step of drawing roads and pathways. We identified some broad and major roads and pathways in our GIS map with the assistance of Google map, Google earth pro, Arc GIS satellite map, QGIS open street map, and GeoDASH. We also used the hand-drawn community map to draw some roads and pathways inside the slum which were not identifiable in the online sources. At that stage, we again reached out to Anwar to verify roads and pathways and he made some corrections.
Step 3 – Identifying infrastructure
After finalizing roads and pathways, we started to pin different important infrastructure like health care facilities, educational institutions, clubs, religious places, open spaces, community centres, cinema halls, bazars, government structures, water, and sanitation facilities, etc. with the help of the Urban Health Atlas, Google earth pro, Google map, and QGIS street map. We found many formal (e.g., hospital, clinic, satellite clinic, etc.) and informal (e.g., pharmacy, drug shops, etc.) healthcare facilities from the Urban Health Atlas.
To precisely pinpoint location of the landmarks, we searched for the coordinates (latitude and longitude) and placed it on our desired map. We tried to identify infrastructures inside the slum from the hand-drawn community map Anwar shared. However, we could not find specific geospatial data of those infrastructure from online sources and it was also not possible for Anwar to collect GIS points for us as he does not have access to required technology. As a result, in this remote method, we could not identify important infrastructure including healthcare facilities located inside the slum. Anwar marked and identified some informal health care facilities within the slum which we could not identify through the online sources.
The final map
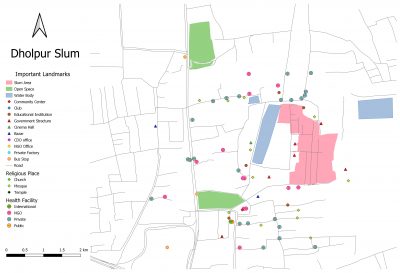
After validating and adding different landmarks, we created the final GIS map of Dholpur slum (Figure 2). We also shared the final map with our Anwar. He was so excited to see the output. This digital GIS map is an additional support to visualize the different facilities within and outside the slum.

Although, the remote method of GIS mapping was very new for us, but we went through a memorable and exciting journey. The challenges we encountered at different stages of mapping process gave us the opportunity to think creatively and identify innovative alternate options and solutions to overcome the challenges. The involvement of Anwar from the beginning made our journey a lot easier. It was really challenging to connect with him remotely because of his engagements in other work and slow internet connections. However, we are very much grateful to him for his time, support, and guidance throughout the mapping process.
Once Indira Gandhi said, “every new experience brings its own maturity and greater clarity of vision,” which we realized throughout the journey of the remote GIS mapping.
